
DentLID data study / Location brief
Car damage locations: front, rear and side.
The front is where first contact is recorded most often. The sides lead when every damaged area is counted. Both statements are true because they measure different things.

Front first.
Sides across the record.
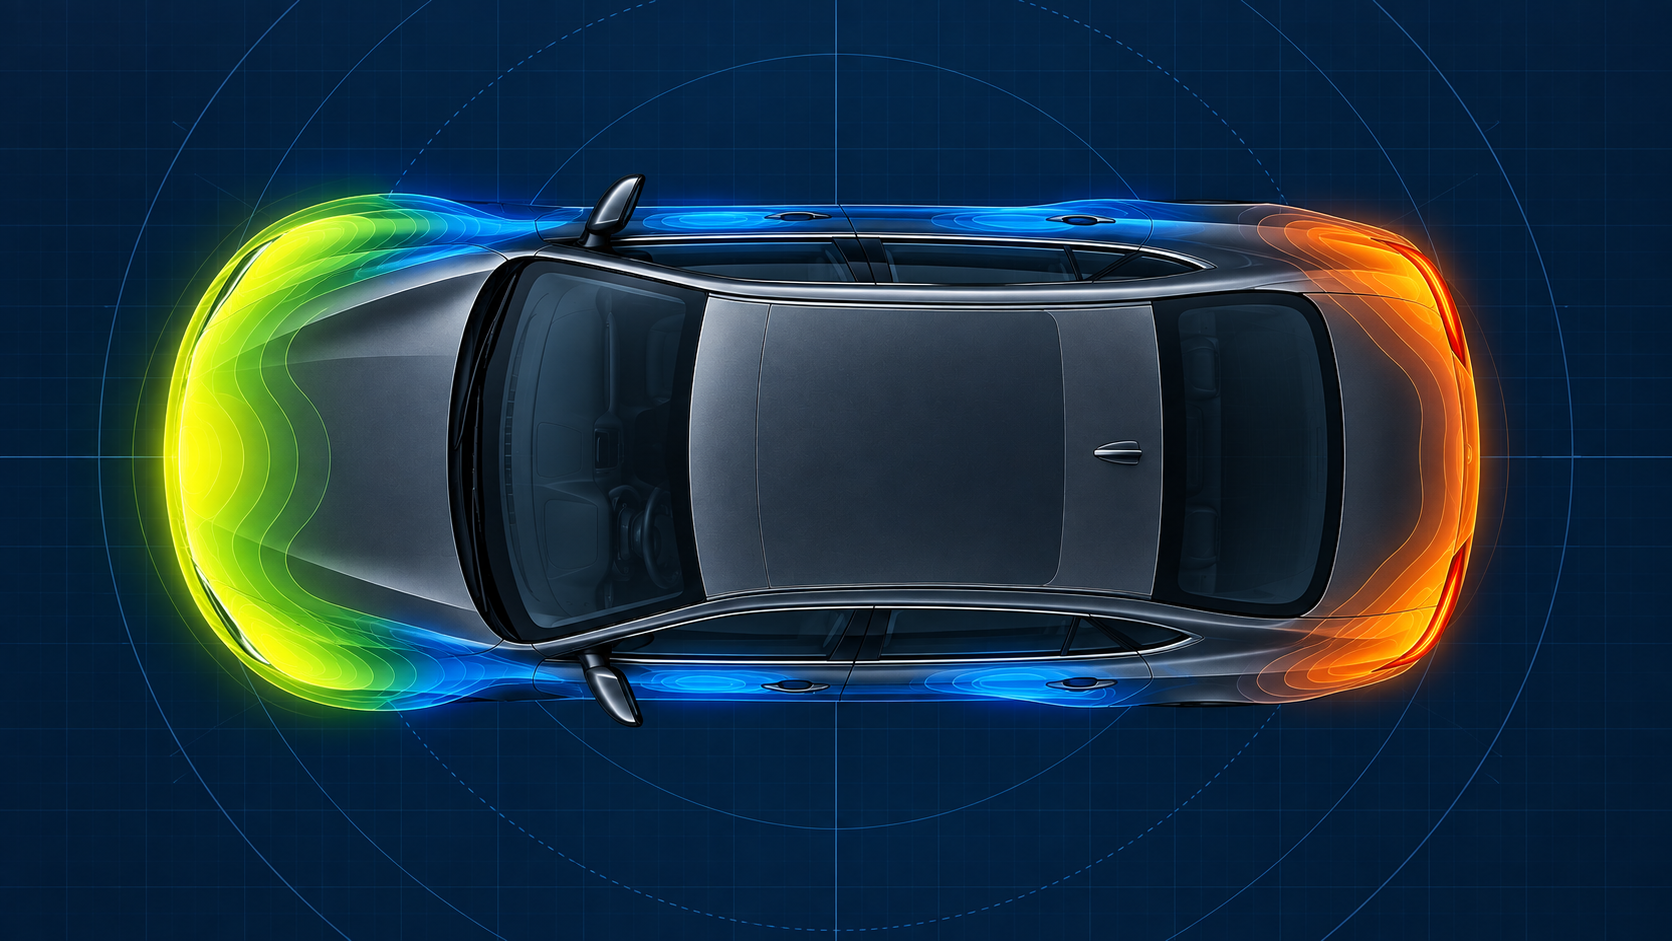
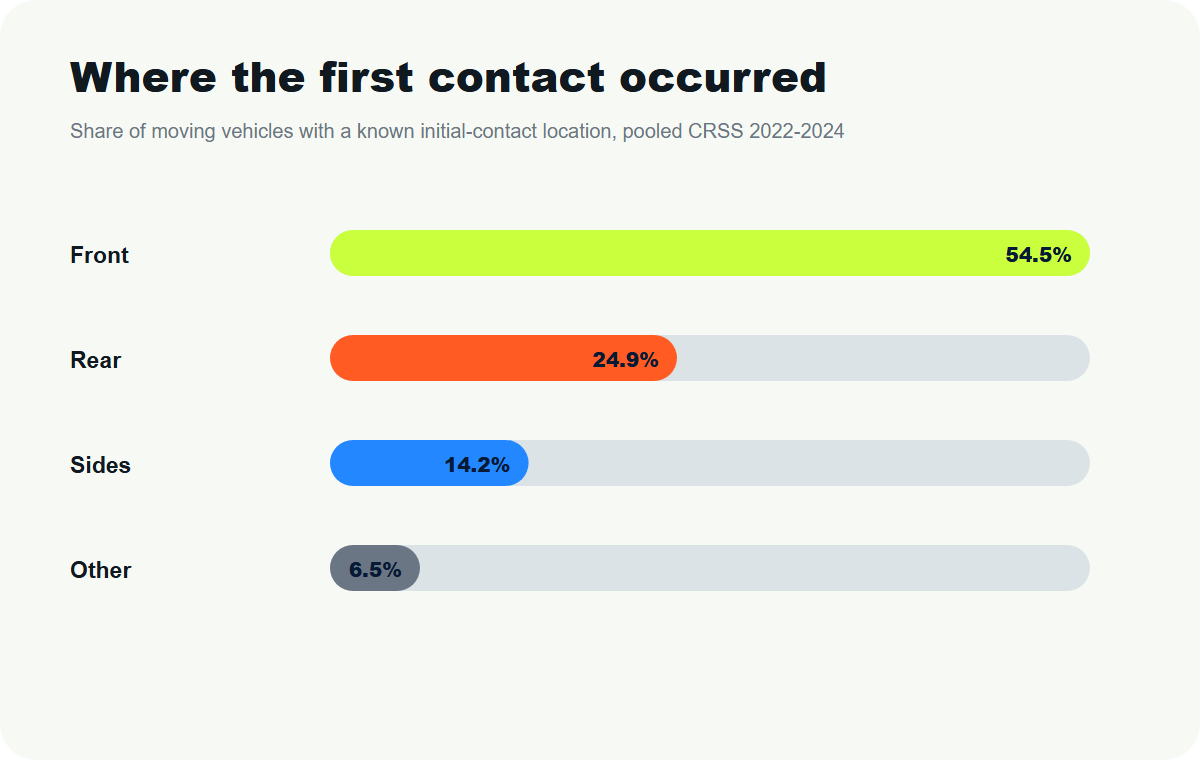
In DentLID’s weighted analysis of the 2022-2024 NHTSA Crash Report Sampling System, the broad front group accounted for 54.5% of moving vehicles with a known initial-contact location. That combines the front center and both front corners.
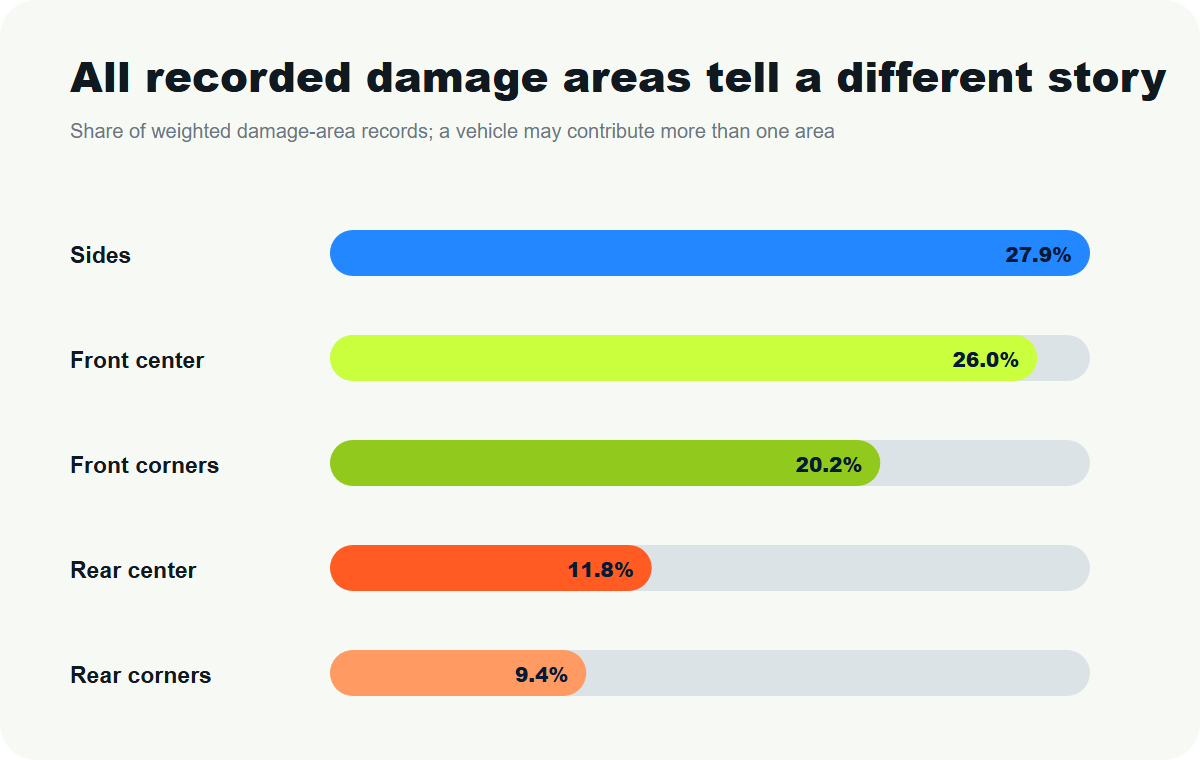
But the damage-area file can record several locations for one vehicle. In that second measure, the combined side group was the largest category at 27.9% of all weighted damage-area records.
Front center plus front corners
Side-area records
Known initial-contact locations
One impact is not the same as one damaged area.
Initial point of impact identifies one location where contact began. Damage areas can include multiple locations on the same vehicle. Comparing them without keeping their denominators separate creates a misleading answer.
Think of the car as a clock face.
NHTSA’s public files describe exterior locations with clock-position labels. Twelve o’clock is the center of the front and six o’clock is the center of the rear. The remaining positions continue around the vehicle perimeter.
DentLID combined those detailed codes into broader consumer-readable regions. This makes the comparison easier to scan, but each group covers a different share of the perimeter.
Measure one
Where did contact begin?
Among records with a known initial-contact location, the front center alone represented 41.35%. The two front corners added 13.10%, bringing the broad front group to 54.45%.
The rear group accounted for 24.86%: 19.71% at the rear center and 5.15% at the rear corners. Sides represented 14.23%. The remaining 6.45% combined other or non-collision locations, the top and the undercarriage.
That is why a front impact can contribute a front-center record, a front-corner record and one or more side-area records in the damage file.
Measure two
Where was damage recorded?
The side group was the largest combined category at 27.90% of all weighted damage-area records. Front center followed at 25.96%, then front corners at 20.20%.
Rear center represented 11.81% and rear corners 9.41%. Top, undercarriage and no-damage codes together made up the remaining 4.73%.
The side group is broad: it combines six clock-position codes across both sides. It should not be interpreted as one door panel, and it does not identify the cause of the damage.
Damage can also spread beyond the location where contact began. Energy can deform adjoining sheet metal, trim and panel edges, while a vehicle may continue moving after the first touch. CRSS records the coded outcome visible in the police report, not a workshop-level reconstruction of how every mark developed.
This is why the area table is best used as a map of recorded involvement. It shows how often broad regions appear across damage records, but it cannot tell whether one mark caused another, how deep a deformation was or which repair method was ultimately used.
See the full U.S. crash-damage studyThree-year check
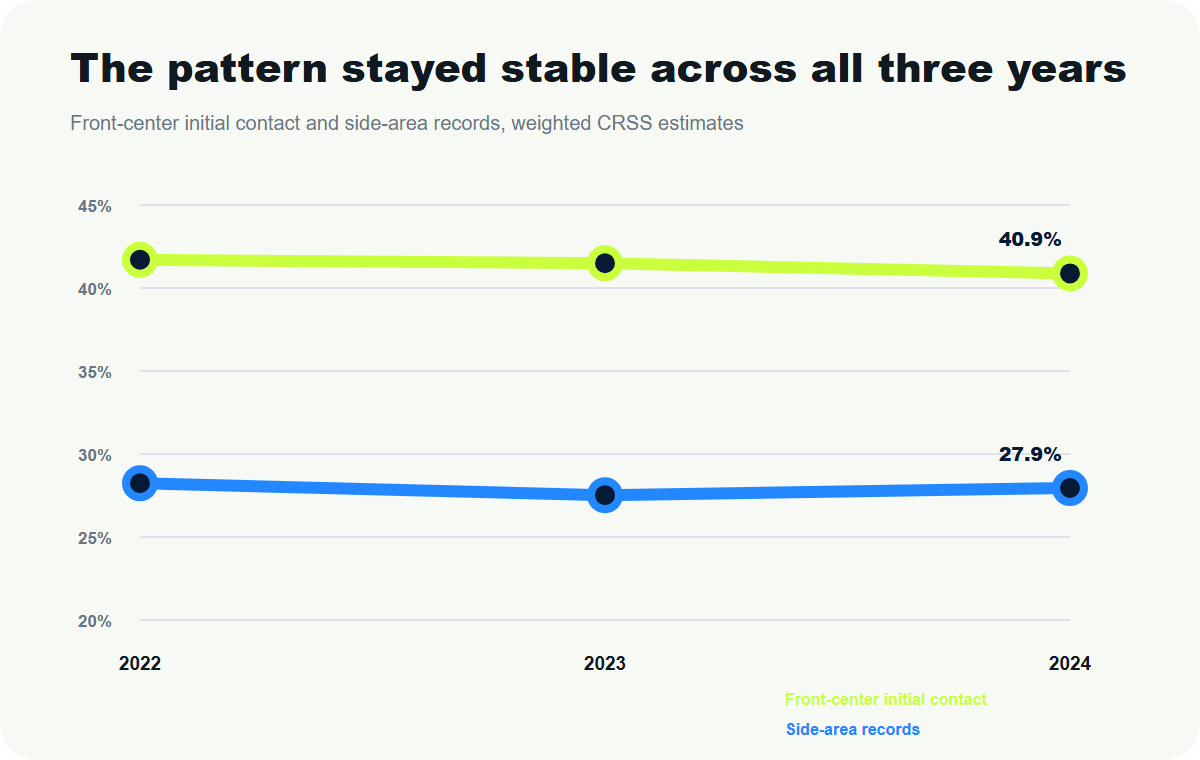
The leading patterns did not hinge on one year.
Front-center initial contact remained between 40.9% and 41.7% in each annual file. Side-area records remained between 27.5% and 28.2%.
Repair reality
Location is not a PDR diagnosis.
A police report’s location code does not show paint condition, dent depth, stretched metal, prior filler, bracing behind the panel or safe tool access. Those details determine whether paintless dent repair may be appropriate.
A shallow door dent with intact paint may be a PDR candidate. A visually similar area with cracked paint, a sharp fold or structural damage may require a body shop. Start with clear photos, not the zone label alone.
Methodology
Four steps from public files to a readable comparison.
Every result keeps the source, weighting and denominator visible.
Public files
We used the NHTSA CRSS 2022, 2023 and 2024 public-use CSV releases. CRSS is a nationally representative probability sample of police-reported crashes, from property-damage-only events through fatal crashes.
Survey weights
Every estimate uses the supplied WEIGHT field. We pooled the three annual files for percentages and retained year and sampling-unit identifiers when estimating standard errors.
Two files
vehicle.csv supplied one IMPACT1 value per moving vehicle. damage.csv supplied one or more DAMAGE records per vehicle.
Transparent grouping
Front combines 12, 11 and 1 o’clock. Rear combines 6, 5 and 7. Sides combine 2, 3, 4, 8, 9 and 10. Top and undercarriage remain separate in the detailed results.
Questions, answered
What the location data does and does not mean.
Short answers to the interpretation questions most likely to change how these results are read.
Where do cars get damaged most in police-reported crashes?
For initial contact, the broad front group led at 54.5% among moving vehicles with a known location. For all recorded damage areas, the combined side group led at 27.9%. The answer changes because the measures use different records and denominators.
Why do sides lead the damage-area results?
A vehicle can have several recorded areas, and the side group combines six clock-position codes across both sides. The result says side locations appeared most often among all coded damage-area records; it does not say that one particular door was the most commonly damaged panel. For a separate view of stationary vehicles, see our parked car damage statistics study.
Does side damage in CRSS mean a door ding?
No. CRSS covers police-reported traffic crashes and does not represent the many minor door dings, cart contacts and parking-lot marks that are never reported. A side-area code also does not identify the object or mechanism by itself.
Can damage location tell me whether PDR will work?
No. Location is only one factor. A technician also needs to evaluate paint condition, depth, shape, metal stretch, panel construction, prior repair and access behind the damage.
Are these raw crash counts?
No. DentLID applied CRSS survey weights to produce national percentage estimates and calculated approximate 95% confidence intervals using the supplied sampling strata and primary sampling units. Sample record counts are shown separately from weighted estimates.
Your car is not a category
Let a technician see the actual panel.
Upload clear photos, vehicle details and ZIP. Available independent PDR technicians can review the damage and respond directly.