
DentLID data study
Where cars are damaged most in reported crashes.
A three-year look at vehicle impact locations, recorded damage areas, first harmful events and vehicle types in nationally representative U.S. police-reported crash data.

front center dominates first contact, but recorded damage spreads across the vehicle.
Read this first
Two questions, not one.
A vehicle can be struck in one place and record damage in several. Keeping those measures separate is the difference between a useful analysis and a misleading dent map.
Where did initial contact occur?
The CRSS initial-contact variable identifies the first point where the vehicle was contacted. Each included vehicle contributes one coded location, subject to unknown and non-contact values.
Which areas recorded damage?
The damage-area file can contain more than one row per vehicle. It describes all coded regions with damage, so its percentages are shares of damage-area records, not shares of vehicles.
Important: this is a study of police-reported crashes, not a census of every door ding, shopping-cart dent, hail mark or PDR job in the United States.
Initial contact
The front center leads by a wide margin.
Across the pooled 2022-2024 sample, 41.35% of weighted initial-contact records were front center. Rear center followed at 19.71%. The front-center estimate has a 95% confidence interval of 40.88%-41.83%.
Initial point of contact by year
Weighted share of moving vehicles in CRSS. Selected grouped locations, percent.
| Location | 2022 | 2023 | 2024 | Three-year pattern |
|---|---|---|---|---|
| Front center | 41.7% | 41.5% | 40.9% | Stable leader |
| Rear center | 19.9% | 19.8% | 19.5% | Stable second |
| Sides | 14.2% | 14.1% | 14.4% | Nearly flat |
| Front corners | 12.3% | 13.2% | 13.8% | Gradual increase |
| Rear corners | 4.7% | 5.2% | 5.5% | Modest increase |
Unknown initial-contact codes represented 1.54% of the pooled weighted total and were retained in the denominator. Percentages shown above are rounded.
All damage areas
Side damage appears most often in the damage-area file.
Once every recorded damage area is counted, the ranking changes. Side regions account for 27.90% of entries, narrowly ahead of front center at 25.96%. That does not mean 27.9% of vehicles had a door dent.
Share of all recorded damage areas, 2022-2024
Weighted CRSS damage-area records. A single vehicle can contribute more than one area.
95% confidence intervals: sides 27.09%-28.72%; front center 25.18%-26.73%; front corners 19.57%-20.82%. Unknown damage-area entries were 1.83% of the weighted total.
First harmful event
Most records begin with another moving vehicle.
CRSS calls this field the first harmful event. It identifies the event that first produced injury or damage, but it should not be presented as a complete causal explanation for the crash.
Vehicle types
The crash sample is shifting toward SUVs.
Passenger cars remain the largest group in the three years analyzed, but their share falls as the SUV share rises. These are sample-composition results, not direct measures of which body style is most likely to be damaged.
Insurance frequency adds context, not a replacement answer.
HLDI collision-loss data use insured vehicle-years, making them more suitable for comparing claim frequency than raw crash counts. In its 2025 summary, four-door cars indexed above the all-vehicle average at 133-149, while pickups were 81-91, SUVs 84-109 and vans 57-82.
Collision claims still include much more than repairable dents. Model mix, driver population, use patterns and repair costs all matter.
The parking-lot blind spot
Everyday dents are undercounted by design.
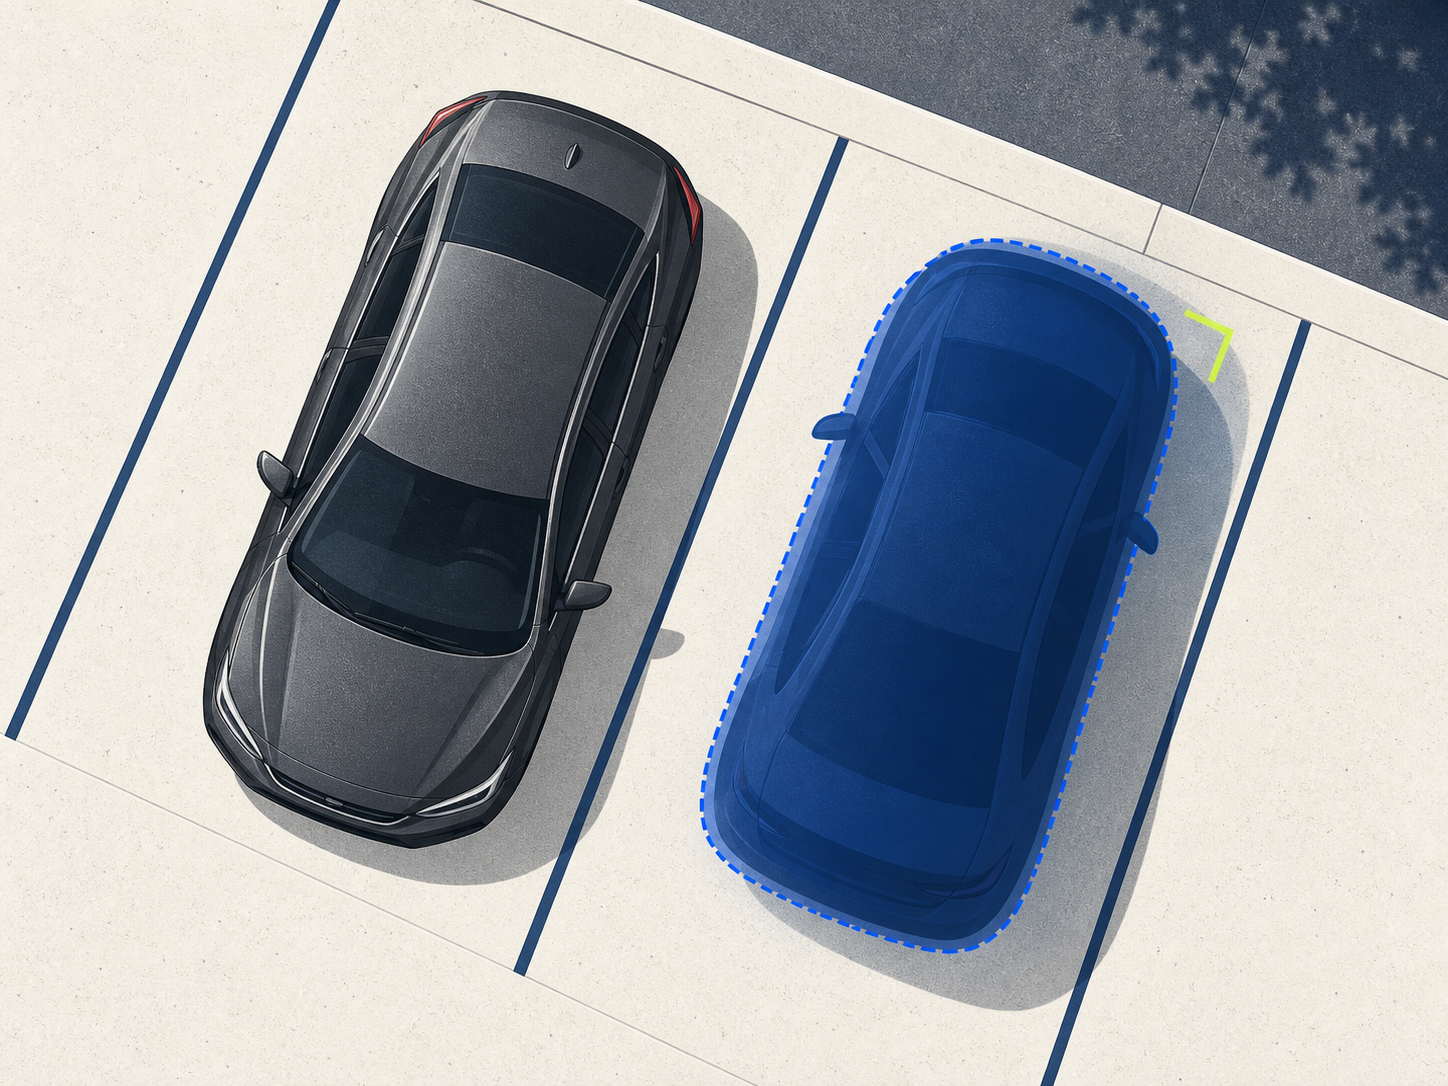
CRSS begins with police-reported crashes. A door opened into a neighboring car, a shopping cart, or a minor scrape that never reaches police or an insurer may leave no standardized public record at all.
That is why this study can map documented crash damage while still being unable to declare the nation’s most common everyday dent.
Repair reality
A location code is not a PDR diagnosis.
CRSS does not record dent depth, metal stretch, paint or clearcoat condition, panel material, backside access, prior bodywork, braces, sensors, wiring or manufacturer restrictions. Photos can support a preliminary assessment, but the final repair method depends on the exact vehicle, panel and damage.
Methodology and limits
How DentLID analyzed the data
We used the 2022, 2023 and 2024 public-use files from the National Highway Traffic Safety Administration’s Crash Report Sampling System. CRSS is a nationally representative probability sample of police-reported motor-vehicle crashes. It is designed for national estimates; the raw file is not a simple census.
The pooled initial-contact analysis contains 272,858 sampled moving-vehicle records. The all-damage-area analysis contains 568,312 coded damage-area records, and one vehicle may contribute multiple rows. We applied the CRSS vehicle weight and accounted for stratification and primary sampling units using Taylor-series variance estimation. Survey years were treated as separate cycles when pooling.
What the percentages mean
Initial-contact percentages describe the weighted distribution of first-contact codes among included moving vehicles. Damage-area percentages describe the weighted distribution of damage-area records. First-harmful-event percentages describe the first event recorded as producing injury or property damage; they are not a complete model of why crashes occur.
What this study cannot tell us
- It does not capture every minor dent or every repair performed outside insurance and police systems.
- It does not show whether a damaged side area was specifically a door, fender or quarter panel.
- It does not prove that top-area damage was caused by hail.
- It does not rate individual makes or models by dent risk.
- It does not determine whether any recorded damage is suitable for paintless dent repair.
Related DentLID guides
For repair-specific guidance, see our pages on door dent repair, Florida hail frequency and mobile PDR coverage in Florida.
Sources
Have a dent of your own?
Send photos and vehicle details. DentLID will check your location and whether an available independent PDR technician may be able to review the actual panel.