
DENTLID RESEARCH / NOAA STORM EVENTS
Florida hail.
30 years
of evidence.
How often does it hail in Florida?
The answer changes with the place, the season and the size of the stone.
1996-2025 · 30 complete years
READ THE NUMBER CORRECTLY
Reports are not storms.
Or your odds of a dent.
One storm can produce reports from several towns. The 837 reports of hail at least 1.25″ occurred on 392 distinct recorded dates statewide, about 13 dates per year. That does not mean every Florida town was hit 13 times a year.
01 / SEASON & TIME
Five months.
Most of the reports.
March through July accounts for 3,917 reports. May and June lead the full dataset. Change the size threshold to see how the pattern shifts.
May: 1,114 reports. June: 1,070. Together, 47% of all reports.
Counts, not probabilitiesTHE AFTERNOON CONCENTRATION
60% in a
four-hour window.
Of the 2,220 reports at 1″ or larger, 1,324 were recorded from 14:00 to before 18:00. That makes afternoon exposure worth thinking about, including parking away from home.
Highlighted: 14:00-17:59 · 1,324 reports
02 / YOUR COUNTY
One state.
Uneven history.
Brevard and Polk have the most reports at 1.25″ or larger in this dataset. These are raw counts: neither county area nor population has been used to adjust them.
COUNTY RECORD
Brevard
- All hail reports
- 197
- Largest recorded size
- 2.50″
Highest large-hail report count in this dataset.
South Florida gets hail, too.
Miami-Dade recorded 29 reports at 1.25″ or larger. Its maximum in this file is 3″, including June 15, 2012. Broward recorded 19, with a maximum of 1.75″.
Compare all county counts
| County | All reports | 1.25″+ | Largest size |
|---|---|---|---|
| Brevard | 197 | 46 | 2.50″ |
| Polk | 206 | 45 | 4.50″ |
| Seminole | 115 | 39 | 3.00″ |
| Orange | 226 | 38 | 2.75″ |
| Duval | 226 | 31 | 2.75″ |
| Volusia | 150 | 31 | 2.00″ |
| Miami-Dade | 203 | 29 | 3.00″ |
| Hillsborough | 192 | 25 | 3.00″ |
| Palm Beach | 141 | 25 | 2.00″ |
| Alachua | 125 | 24 | 2.75″ |
| St. Johns | 103 | 23 | 3.00″ |
| St. Lucie | 74 | 22 | 2.75″ |
| Lake | 98 | 20 | 2.75″ |
| Leon | 113 | 20 | 2.00″ |
| Broward | 183 | 19 | 1.75″ |
| Martin | 60 | 19 | 2.00″ |
| Osceola | 81 | 19 | 2.00″ |
| Marion | 118 | 18 | 4.50″ |
| Escambia | 57 | 17 | 2.00″ |
| Putnam | 96 | 15 | 2.00″ |
| Bay | 54 | 14 | 2.00″ |
| Lee | 96 | 14 | 1.75″ |
| Suwannee | 53 | 14 | 2.75″ |
| Santa Rosa | 65 | 12 | 2.75″ |
| Clay | 99 | 11 | 2.00″ |
| Nassau | 84 | 11 | 2.75″ |
| Highlands | 50 | 10 | 1.75″ |
| Madison | 30 | 10 | 1.75″ |
| Manatee | 57 | 10 | 1.75″ |
| Pinellas | 73 | 10 | 3.00″ |
| Citrus | 61 | 9 | 2.00″ |
| Columbia | 47 | 9 | 2.00″ |
| Flagler | 110 | 9 | 2.00″ |
| Hendry | 27 | 9 | 2.75″ |
| Jackson | 43 | 9 | 1.75″ |
| Walton | 52 | 9 | 2.75″ |
| Bradford | 30 | 8 | 4.50″ |
| Collier | 51 | 8 | 1.75″ |
| Gadsden | 23 | 8 | 2.75″ |
| Hamilton | 47 | 8 | 2.75″ |
| Okeechobee | 42 | 7 | 2.50″ |
| Taylor | 17 | 7 | 3.00″ |
| Calhoun | 27 | 6 | 1.75″ |
| Gulf | 22 | 6 | 2.00″ |
| Pasco | 78 | 6 | 3.00″ |
| Baker | 31 | 5 | 2.00″ |
| Jefferson | 17 | 5 | 1.75″ |
| Levy | 49 | 5 | 1.75″ |
| Liberty | 20 | 5 | 1.75″ |
| DeSoto | 17 | 4 | 2.75″ |
| Franklin | 9 | 4 | 1.75″ |
| Gilchrist | 26 | 4 | 1.75″ |
| Glades | 26 | 4 | 1.75″ |
| Hardee | 23 | 4 | 2.00″ |
| Indian River | 53 | 4 | 1.75″ |
| Sarasota | 29 | 4 | 1.75″ |
| Union | 15 | 4 | 2.75″ |
| Wakulla | 27 | 4 | 1.75″ |
| Charlotte | 27 | 3 | 1.75″ |
| Monroe | 8 | 3 | 1.75″ |
| Okaloosa | 52 | 3 | 1.75″ |
| Sumter | 26 | 3 | 1.75″ |
| Washington | 22 | 3 | 1.75″ |
| Hernando | 22 | 2 | 1.75″ |
| Holmes | 11 | 2 | 1.75″ |
| Lafayette | 4 | 2 | 1.75″ |
| Dixie | 11 | 1 | 1.75″ |
03 / SIZE & HISTORY
Size changes
what the number means.
The current NWS severe-hail criterion is 1″. This study also tracks 1.25″ and larger as a separate size group. Neither threshold predicts damage to a particular car.
Includes two reports with no size entered.
48% of the full dataset meets today’s severe-hail size criterion.
18% of the full dataset falls in the study’s larger-hail group.
4.5″ is the maximum
in this file.
Three reports list that size: Polk in 1996, Bradford in 2003 and Marion in 2007. It is the maximum observed in this 30-year dataset, not a claim about every storm in Florida’s history.
Open the original hail-size referenceWhy not average
the stone sizes?
Reports cluster around familiar comparisons: 1,611 at 0.75″ and 1,383 at 1″. There are 477 at exactly 1.75″ versus 103 at 1.50″. Threshold counts communicate this stepped distribution more clearly than a single average.
NWS hail criteria and safety guidanceChoose a year to see both counts.
Smaller-hail reports become less common later in the series. Changes in reporting can affect the totals. The file alone cannot establish a climate explanation, and it omits every year before 1996.
Read the yearly values
47 large
28 large
53 large
61 large
22 large
29 large
21 large
42 large
18 large
49 large
30 large
23 large
23 large
20 large
13 large
34 large
33 large
13 large
20 large
9 large
17 large
14 large
21 large
16 large
30 large
23 large
29 large
50 large
24 large
25 large
04 / CARS IN ITS PATH
Where cars are registered
is only part of the story.
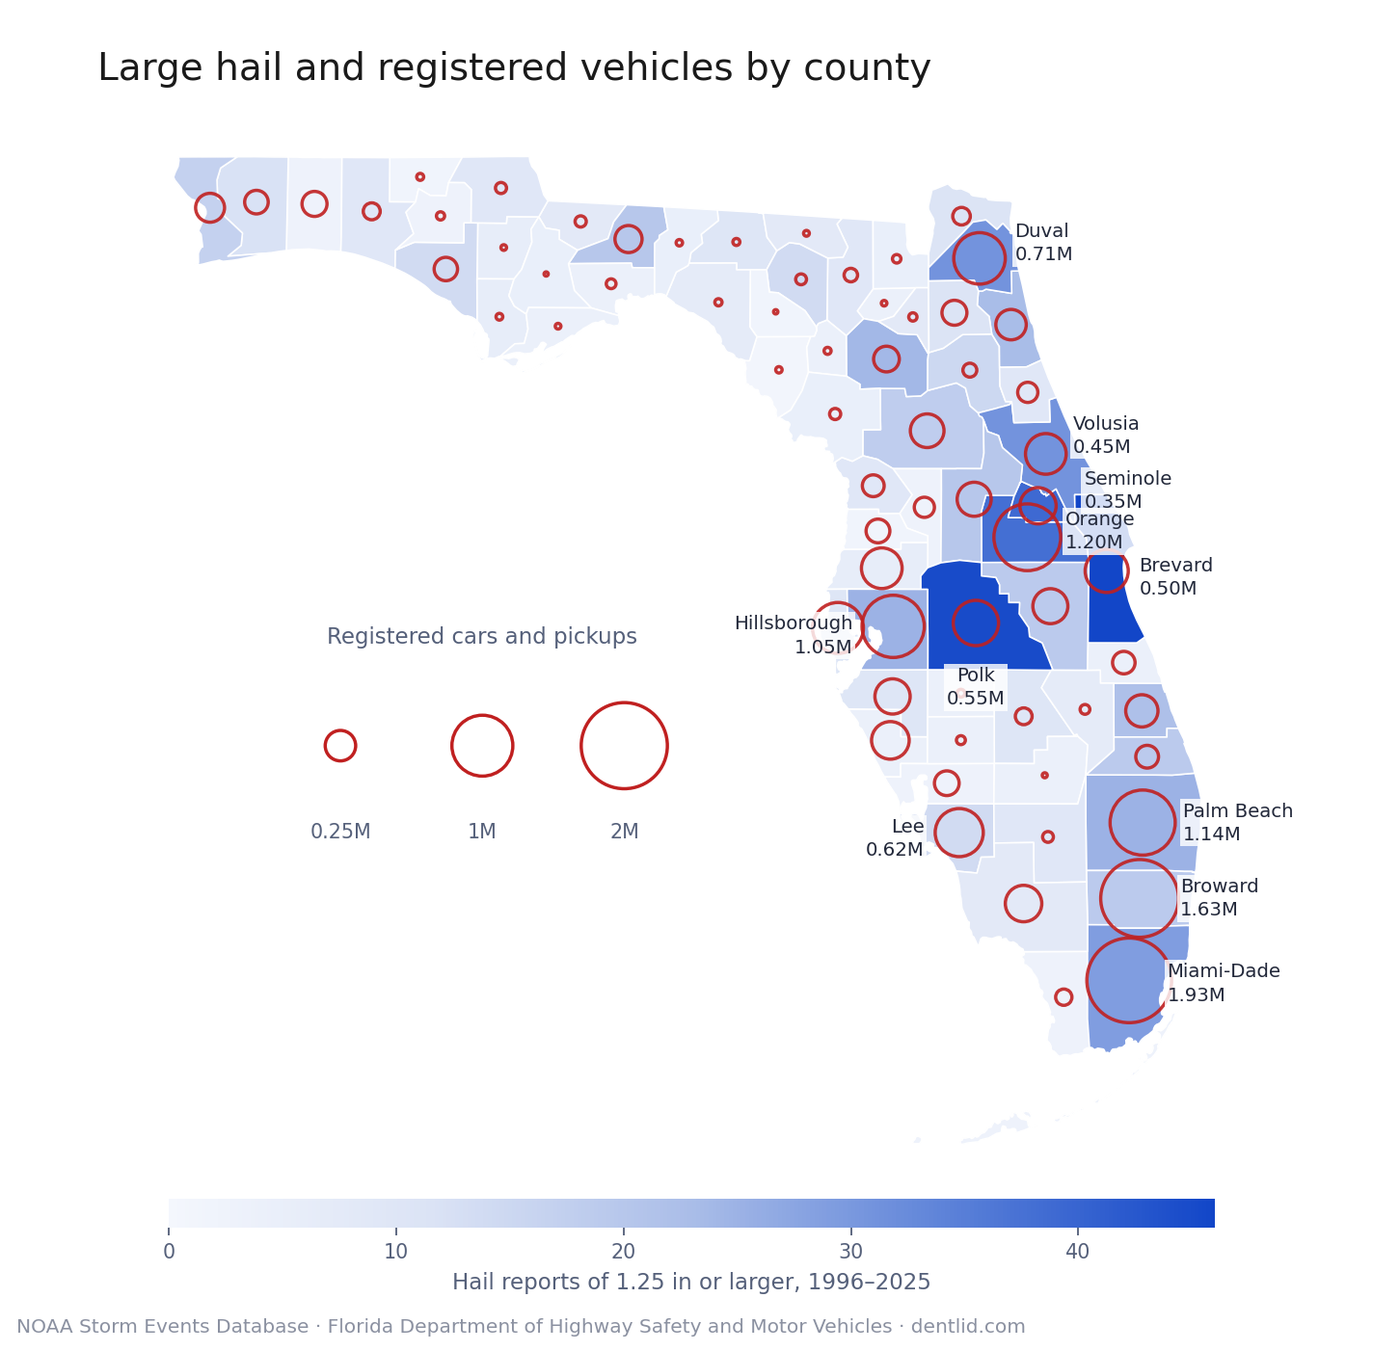
The original article pairs the hail record with Florida’s April 2025 registration snapshot. It describes the size of the fleet, not the number of vehicles struck by hail.
17,209,342 in the original state snapshot
Miami-Dade, Broward, Orange, Palm Beach and Hillsborough together account for about 40% of that fleet. Orange leads those five in large-hail reports, with 38.
Brevard and Polk recorded more large-hail reports, but each had roughly half Orange’s registered fleet.
The data cannot tell us which cars were exposed during a storm, insured, damaged or repaired.
AFTER A HAILSTORM
Inspect the car.
Then compare your options.
Hail can damage paint, metal and glass. The result depends on the stones, wind, exposure and vehicle. A weather report cannot determine the repair method or cost.
The original repair guide puts moderate hail damage around $1,000-2,500 and severe multi-panel work at $2,500 to $10,000+. These are broad repair-guide ranges, not estimates derived from NOAA reports. Paint condition, access, materials and the inspection determine the actual quote.
05 / THE PRACTICAL QUESTIONS
What the data can tell you.
Does it hail in South Florida?
Yes. The file contains 29 reports of hail at least 1.25 inches in Miami-Dade and 19 in Broward. Their recorded maximum sizes are 3 inches and 1.75 inches respectively. A county count is not a yearly probability for your location.
Which month has the most hail in Florida?
May has the most reports in this dataset: 1,114, followed by June with 1,070. Together they account for 2,184 of 4,627 reports. The monthly chart lets you compare different size thresholds.
What is the largest hailstone recorded in this study?
The maximum reported size in the 1996-2025 file is 4.5 inches. Three records list that size, in Polk in 1996, Bradford in 2003 and Marion in 2007. Earlier events are outside this study.
What size hail damages a car?
Hail can dent panels and damage paint or glass, but there is no universal damage threshold for every vehicle. One inch is the current NWS severe-hail size criterion, not a guarantee of a particular repair outcome. Inspect the car after the storm and seek a repair assessment.
What time of day does hail fall in Florida?
The reports concentrate in the afternoon. Among 2,220 reports at one inch or larger, 1,324 begin between 14:00 and before 18:00 in the supplied NOAA standard-time fields. The hourly chart has not been converted to daylight-saving clock time.
06 / DATA & METHOD
Open data.
Visible limits.
CSV · Florida · Hail · 1996-2025
What was counted
The linked NOAA Storm Events Database extract contains 4,627 records with unique event IDs. A record is a reported event, not necessarily a distinct storm. Month, hour, year and county totals were recomputed from this file.
What is missing
Two records have no magnitude. They remain in all-report totals and are excluded from size thresholds. Two records have no beginning coordinates and are omitted from the point map. Zero county counts mean no matching report in this extract, not no hail ever.
Time and location
Hourly bins use BEGIN_TIME as recorded with NOAA’s EST/CST time-zone fields. No daylight-saving conversion has been applied. The map plots beginning coordinates; overlapping points remain overlapping. County shading is not adjusted for area or population.
What cannot be inferred
Reporting follows people and observation as well as weather. The file cannot establish an individual car’s damage, claim probability or a causal climate trend. Size comparisons are approximate; the vehicle overlay is a separate 2025 registration snapshot.
View the original published figures
The original figures remain available for reference. The maps predate the missing-field audit above; use the current chart counts and methodology when quoting this study.
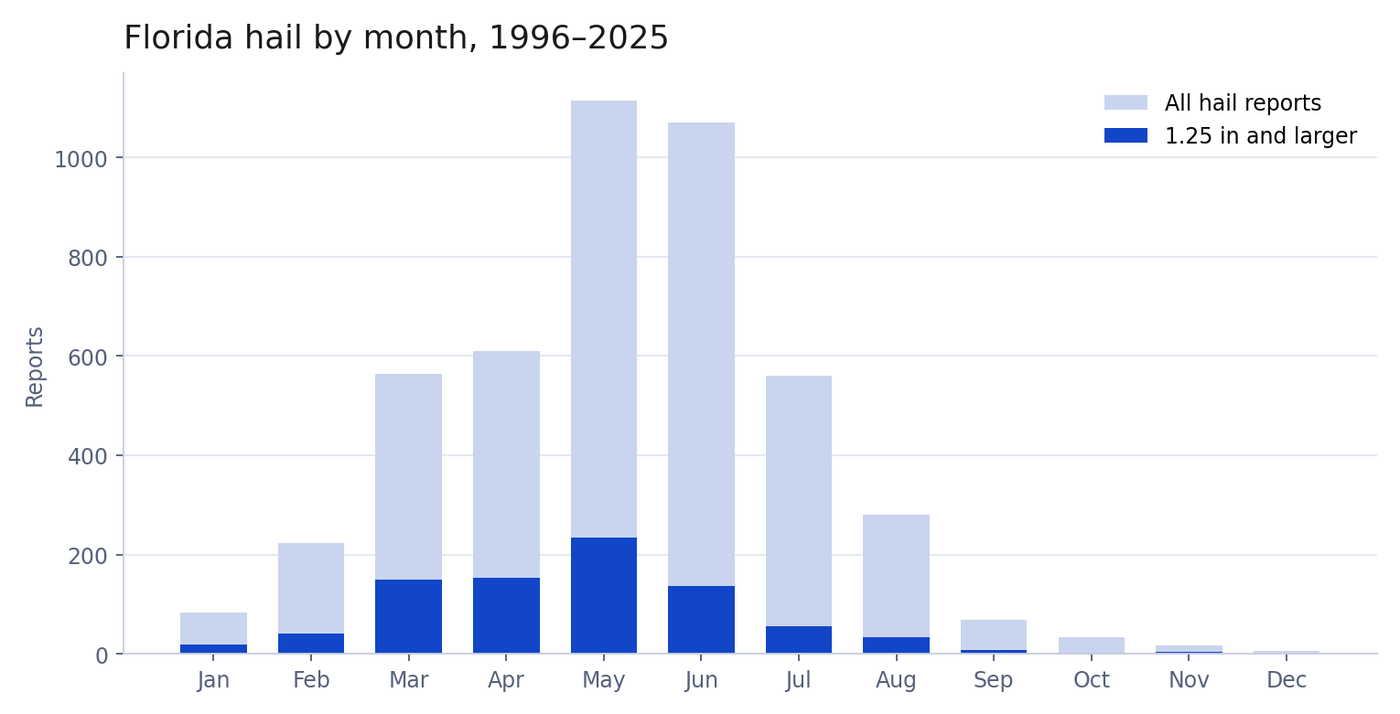 Chart of Florida hail reports by month, showing a March to July season peaking in May and June
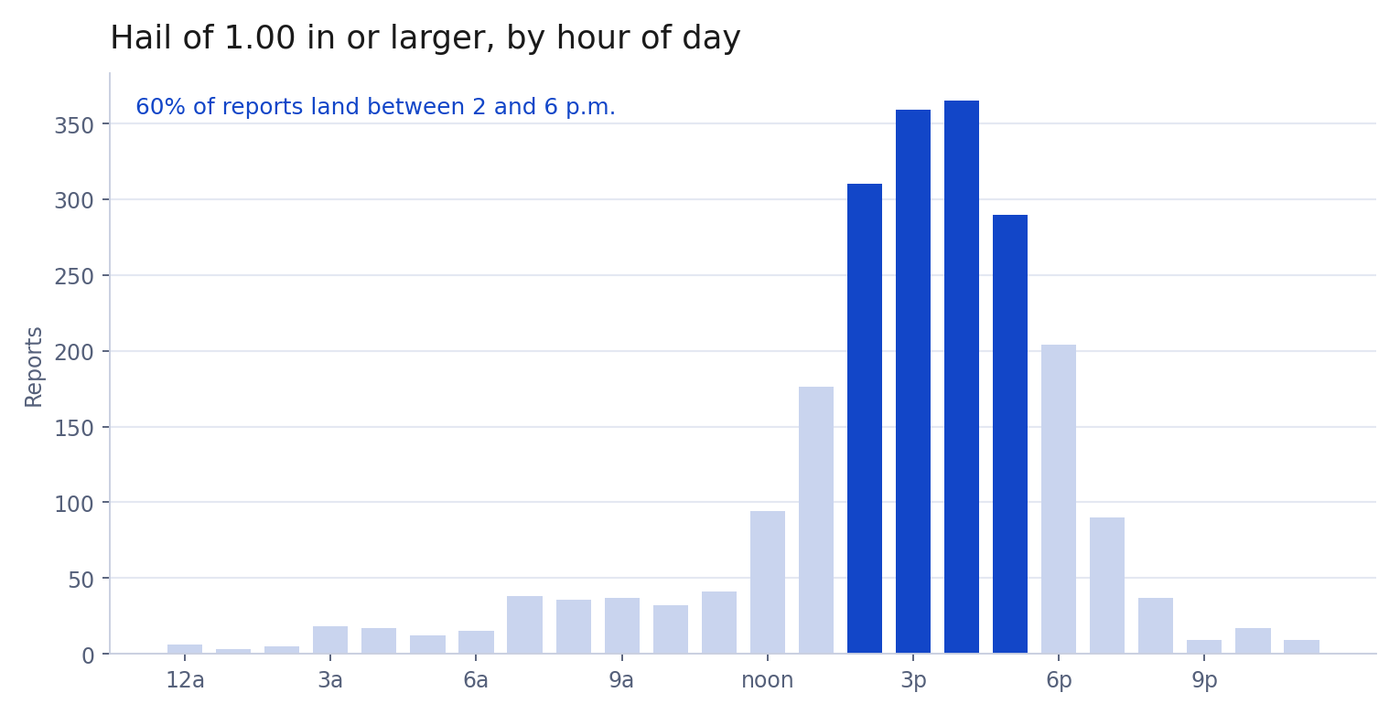 Chart of Florida hail reports by hour, showing most large hail falls between 2 and 6 p.m.
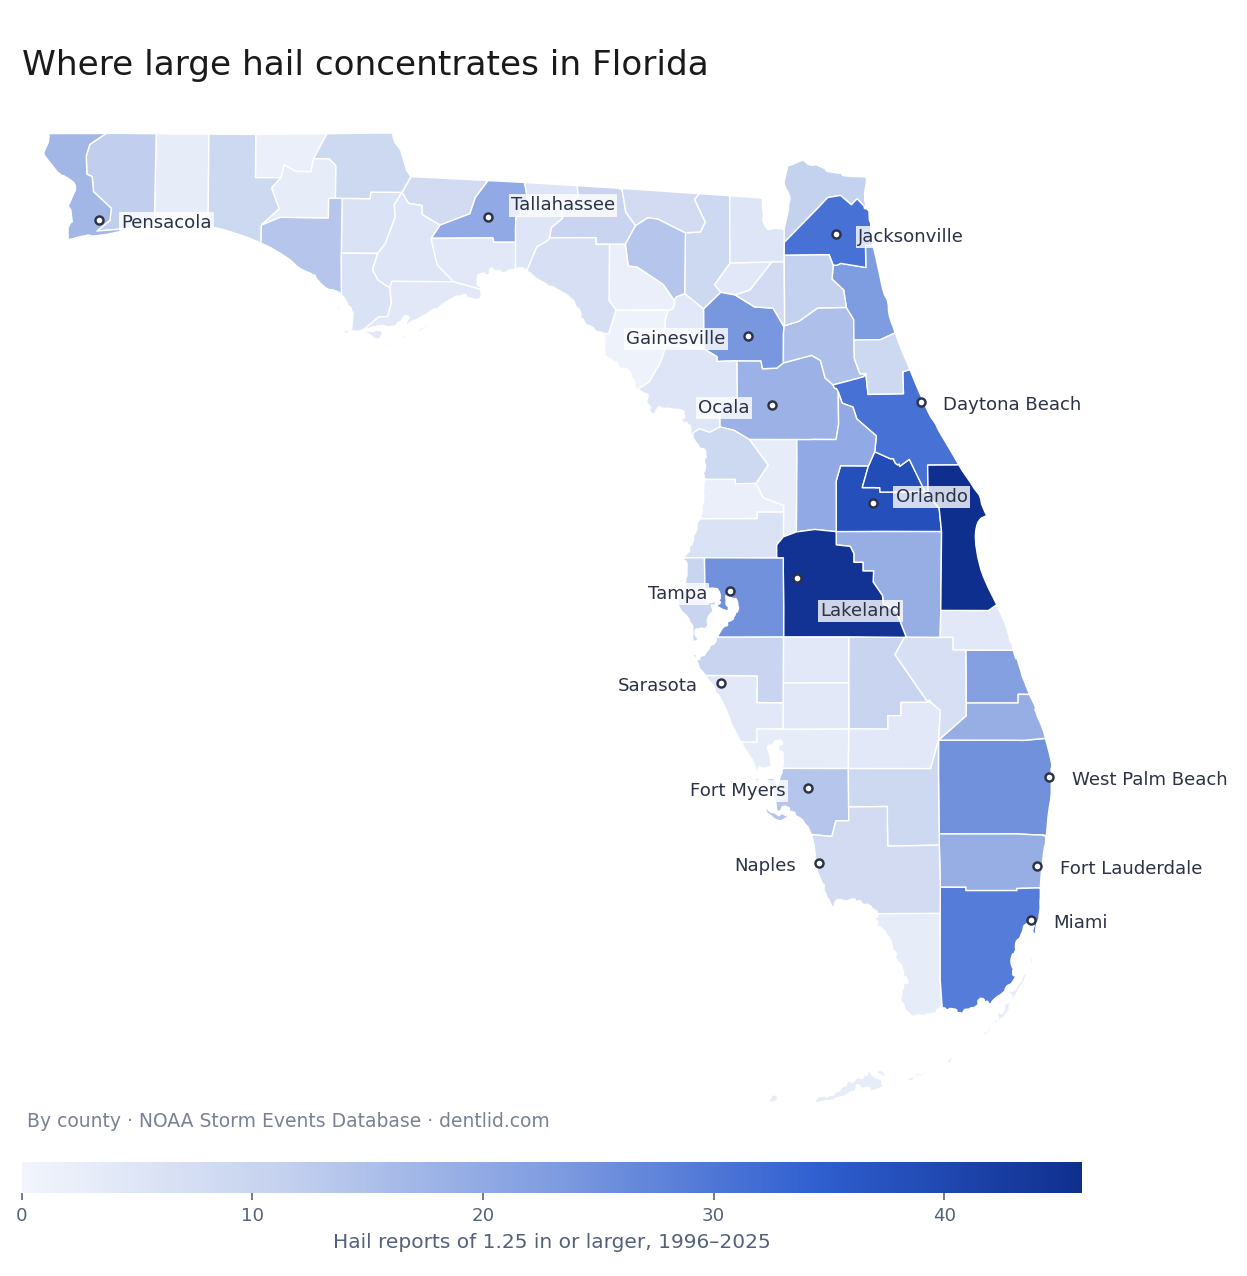 Choropleth map of Florida counties shaded by number of hail reports of 1.25 inches or larger since 1996
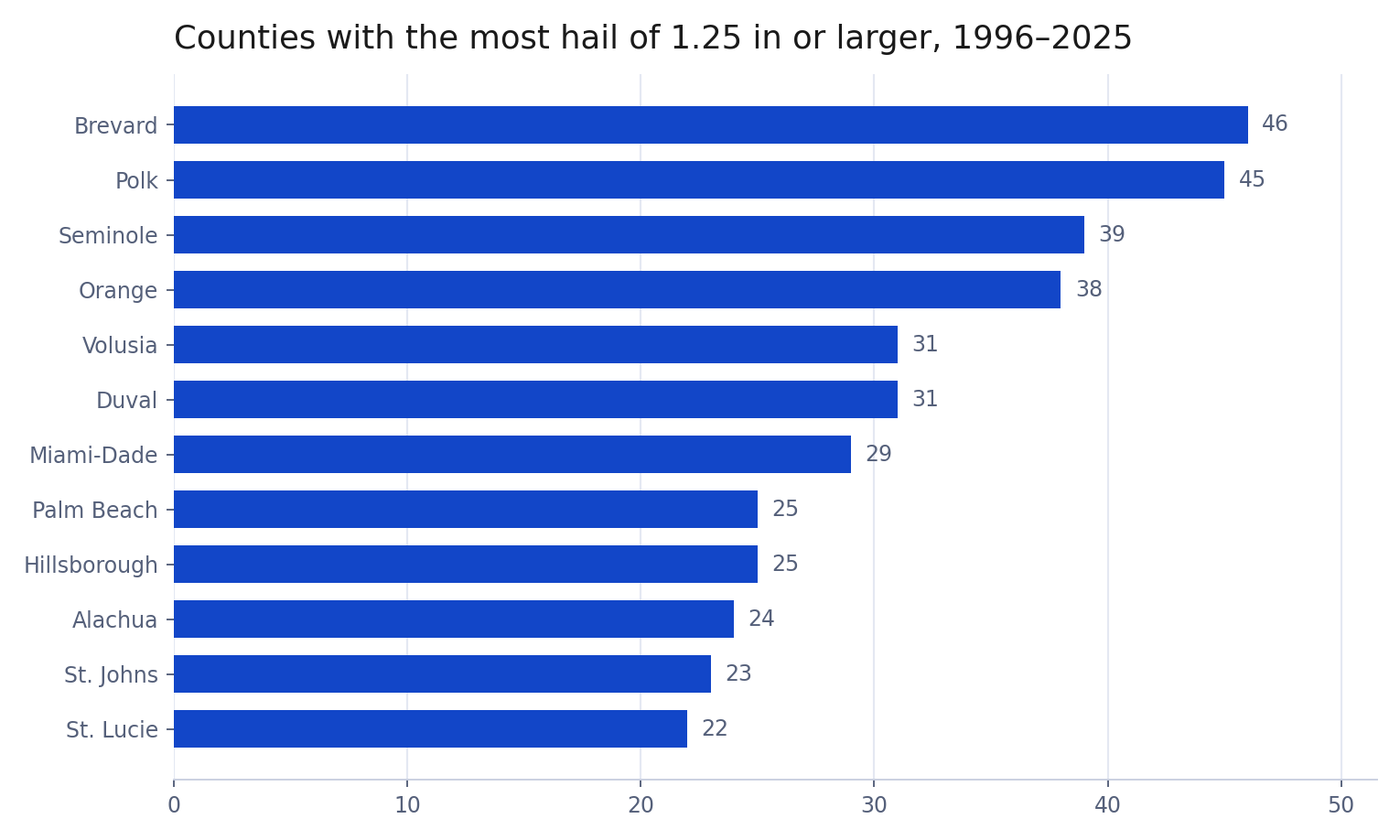 Florida counties ranked by number of hail reports of 1.25 inches or larger since 1996Map of Florida counties shaded by large hail frequency with circles sized by registered vehicles
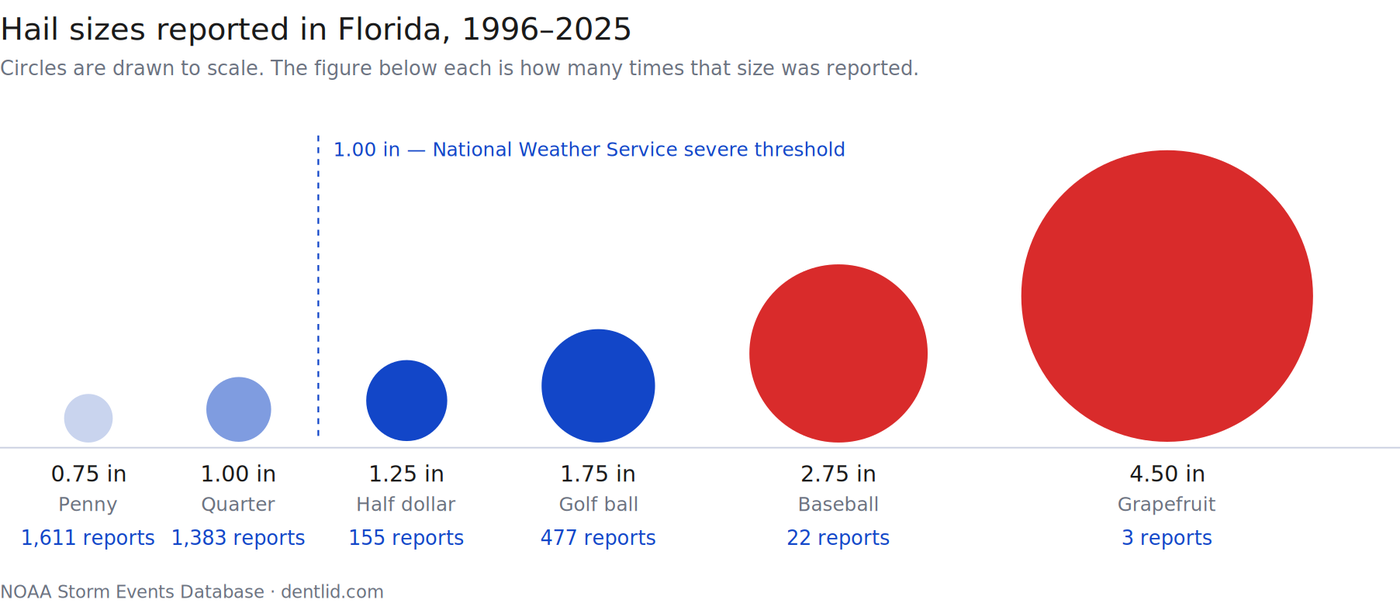 Hail sizes reported in Florida compared to a penny, quarter, golf ball and grapefruit
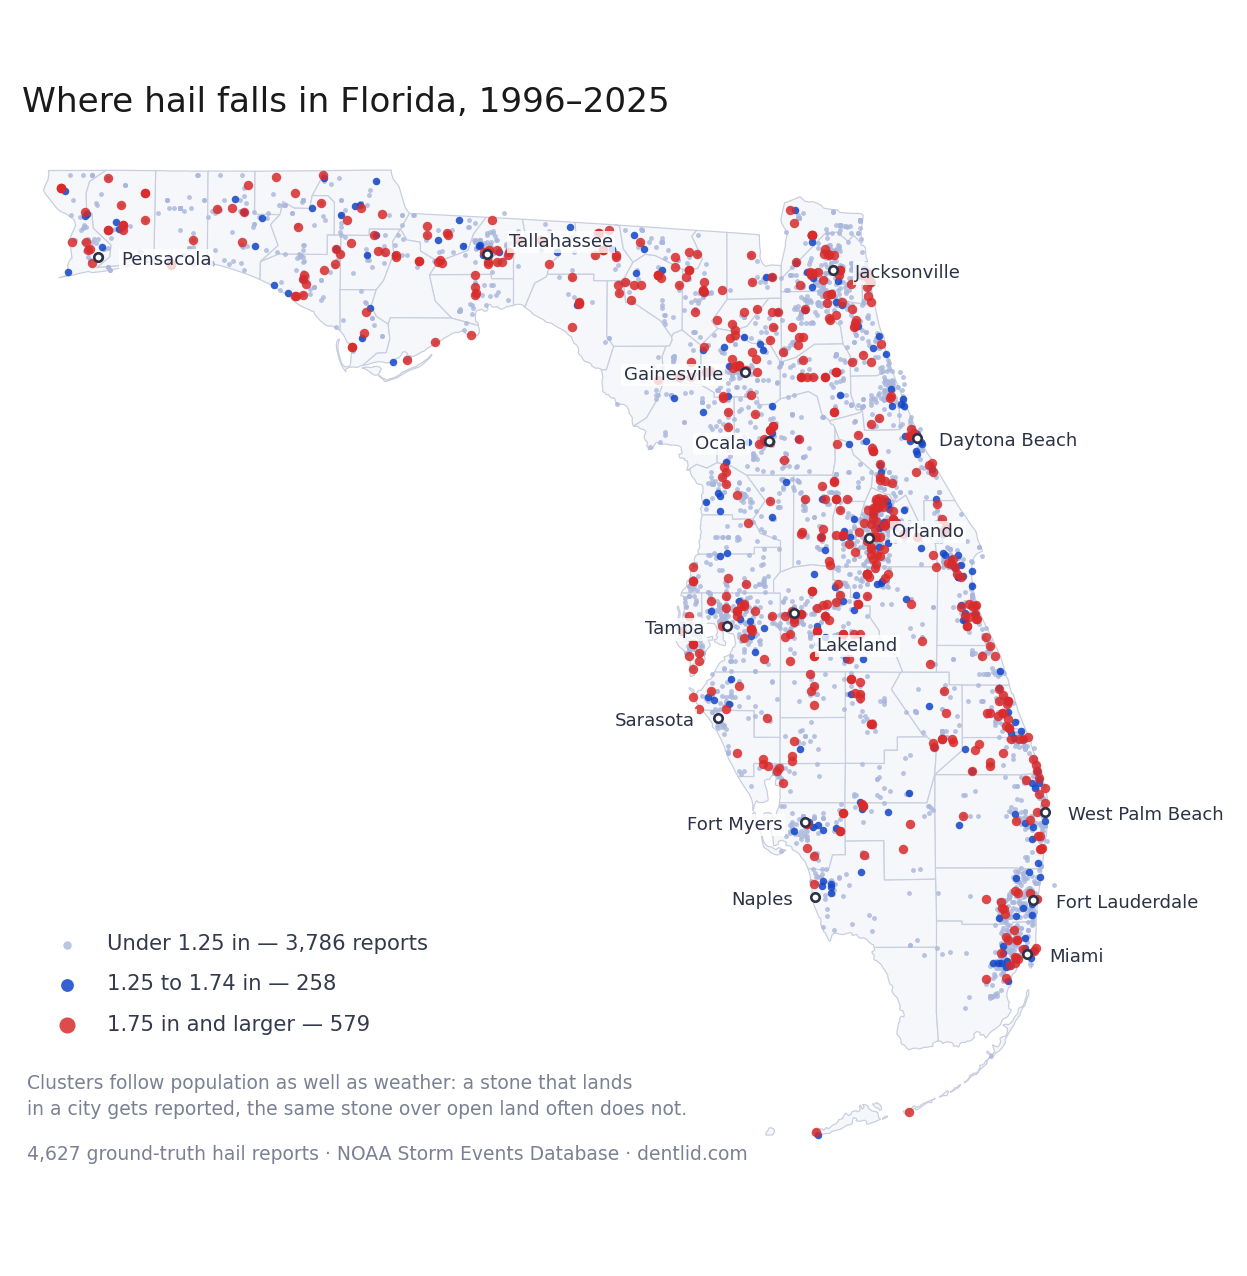 Map of 4,627 hail reports across Florida from 1996 to 2025, colored by hailstone size
NOAA data is public domain. Credit NOAA as the original data source and DentLID for this analysis. This is a historical study, not a current weather alert.
HAIL LEFT A DENT?
One request.
Available local estimates.
Send your photos once, compare available responses from independent PDR technicians and choose who to contact.
Free to use. No obligation. Phone optional.
Availability varies by ZIP.