
DENTLID DATA STUDY / PARKED VEHICLE DAMAGE
Parked Car Damage Statistics: Where Cars Get Hit Most
These parked car damage statistics use three years of NHTSA data to show where contact starts in police-reported crashes. The rear zone leads by a wide margin, but everyday parking dents are mostly outside this dataset.
Short answer
The rear appears nearly twice as often as the front.
Among parked passenger cars, SUVs, pickups and vans in CRSS, the rear group accounted for 44.60% of known initial-contact locations. Side locations accounted for 25.32%, and the front group for 23.71%.
These are not statistics for every parking dent. CRSS covers police-reported traffic crashes in which at least one vehicle was in transport on a trafficway.
parked light vehicles in the CRSS target population
motor vehicle in transport
among records with known occupancy
Where contact began
The rear group leads in all three years.
This is the initial area of contact, not a list of every damaged panel. Each vehicle contributes one initial location.
The rear group leads by a wide margin.
Survey-weighted CRSS estimate
2022-2024
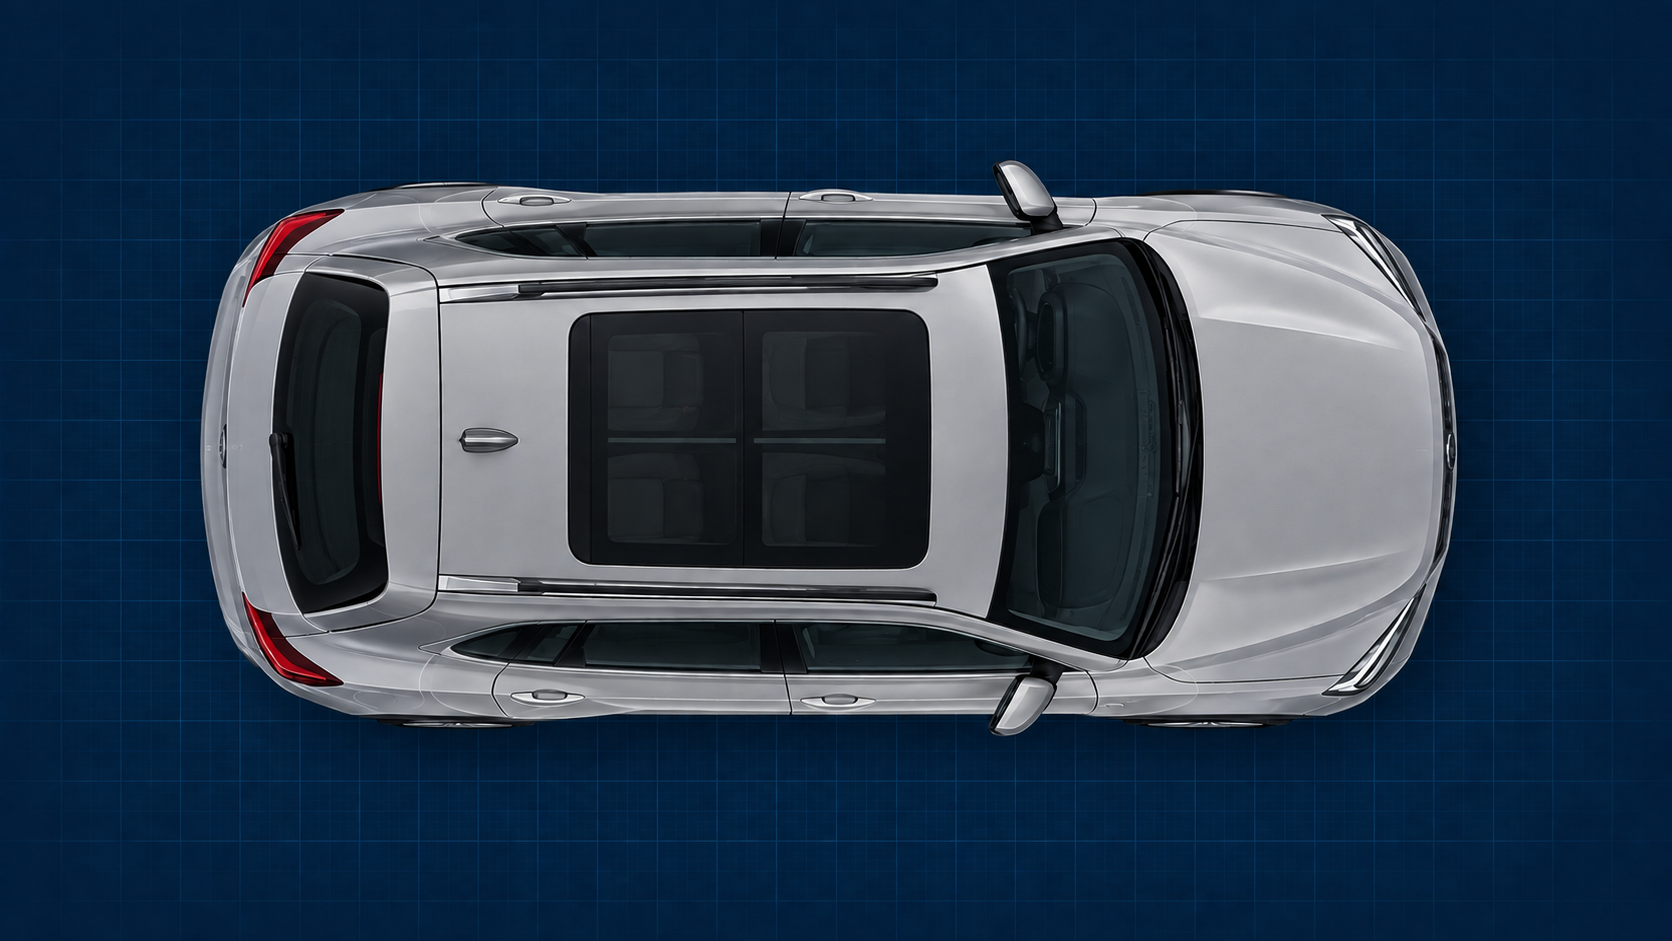
Exact clock-code map. The continuous field intensity is scaled to the weighted share at each position.
The 12 clock positions cover 90.15% of records. Another 9.52% have only broad Left/Right codes and are not assigned to an invented point.95% CI: 42.82-46.39%
95% CI: 23.85-26.79%
95% CI: 22.40-25.02%
YEAR-BY-YEAR CHECK
The result is not driven by one unusual year.
The rear group ranked first in all three annual files. Small year-to-year changes did not alter the overall order.
DID THE DRIVER LEAVE?
Four in ten records included a hit-and-run flag.
For each parked vehicle, we checked every moving vehicle in the same crash. In 41.28% of records, at least one was coded as hit-and-run.
This is a crash-level association. If several moving vehicles were involved, the public file alone does not prove which one contacted the parked vehicle.
coded hit-and-run
Crash context
Where the vehicle was parked and what happened next.
These measures describe the mix of reported crashes. Without exposure data, they do not estimate an individual vehicle’s risk.
Parking lane or parking zone
unoccupied
At least one occupant was present in 9.39% of records.
Motor Vehicle In-Transport
In the great majority of known records, the most harmful event was a motor vehicle in transport.
KNOWN VEHICLE DAMAGE SEVERITY
Nearly half of records were coded as minor damage.
The NHTSA category does not determine whether paintless dent repair will work. It does not show paint condition, depth, metal stretch or access behind the panel.
- Minor damage45.71%
- Functional damage32.31%
- Disabling damage21.20%
- No damage0.78%
WHEN CRASHES WERE RECORDED
Day and evening contain more records. That is not proof of risk.
Without the number of parked vehicles and the time they spend exposed, we see the distribution of crashes, not the probability of damage.
None of these measures supports a causal conclusion without an appropriate exposure denominator.
Where open data stops
CRSS misses most everyday parking dents.
Police-reported crashes
- the initial area of contact;
- most harmful event;
- hit-and-run coding for moving participants;
- damage severity, tow status and occupancy;
- time, weather and relation to roadway.
Every parking dent
- unreported door dings;
- shopping-cart strikes;
- vandalism and many private-lot incidents;
- the exact damaged panel;
- whether a dent is suitable for paintless dent repair.
Parked records have no linked rows in damage.csv.
That is why this study maps one initial-contact location. For the broader crash comparison, see our study of where cars get damaged most. We do not invent a map of every damaged panel or transfer damage records from moving vehicles to parked vehicles.
METHODOLOGY
How DentLID built the comparison.
Each estimate retains its own denominator, survey weight and scope limit.
Three annual files
Public NHTSA CRSS CSV files for 2022, 2023 and 2024.
One parked-vehicle record
The primary unit of analysis is one light passenger vehicle in parkwork.csv.
Survey weights
We used WEIGHT, PSUSTRAT and PSU_VAR rather than simple raw percentages.
Separate denominators
Unknown and Not Reported values are excluded only from the specific measure being calculated.
Questions, answered
What these numbers mean.
Where are parked cars hit most often in police-reported crashes?
In our survey-weighted CRSS sample, the rear group led with 44.60% of known initial-contact locations. Side locations accounted for 25.32%, and the front group for 23.71%.
Does this mean the rear bumper gets dented most often?
No. The group combines the rear center and both rear corners. The code does not identify a specific panel or describe the shape of the damage.
Does 41.28% mean the striking driver definitely fled?
It is the share of records in which at least one moving vehicle in the same crash was coded hit-and-run. In a multi-vehicle crash, the file does not always tie that flag to a specific contact.
Does the study include door dings and shopping carts?
Only when the incident was part of an eligible police-reported CRSS crash. Most small, unreported damage never enters the sample.
Can these data tell whether paintless dent repair will work?
No. A decision requires photos, paint condition, damage depth and shape, metal stretch and access behind the panel.
YOUR CAR IS NOT A STATISTIC
Show the actual damage to a specialist.
Upload photos, vehicle details and your ZIP code. Available independent PDR technicians can assess the actual panel rather than a statistical region.